

Cherokee Schools Score 87; Attendance Remains a Priority
CENTRE– Cherokee County Schools’ latest accountability report card shows improved college and career readiness and fewer chronic absences. However, attendance remains a concern, especially among high school juniors and seniors.
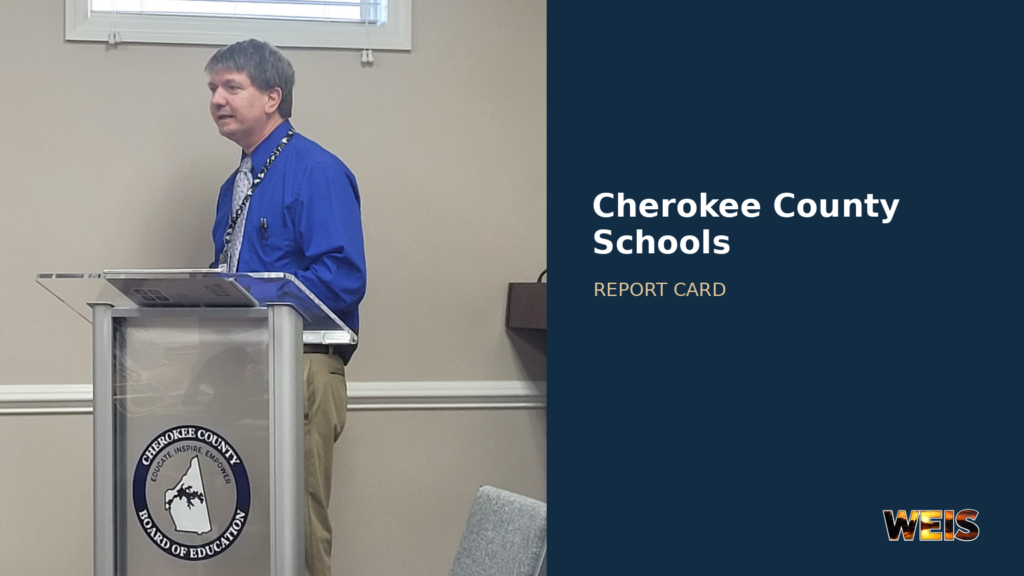
Stephen Ingram presented the results to the Cherokee County Board of Education on Nov. 12. The district earned an overall score of 87, compared with 88 on its 2025 report card.
Although the score slipped one point, the individual measures show a more detailed picture. Achievement, growth, and graduation declined, while career readiness and attendance improved.
Ingram urged the board to look beyond the overall number. He also emphasized using the findings to strengthen instruction and give students more opportunities to succeed.
cherokee-schools-report-card-wordpress-package 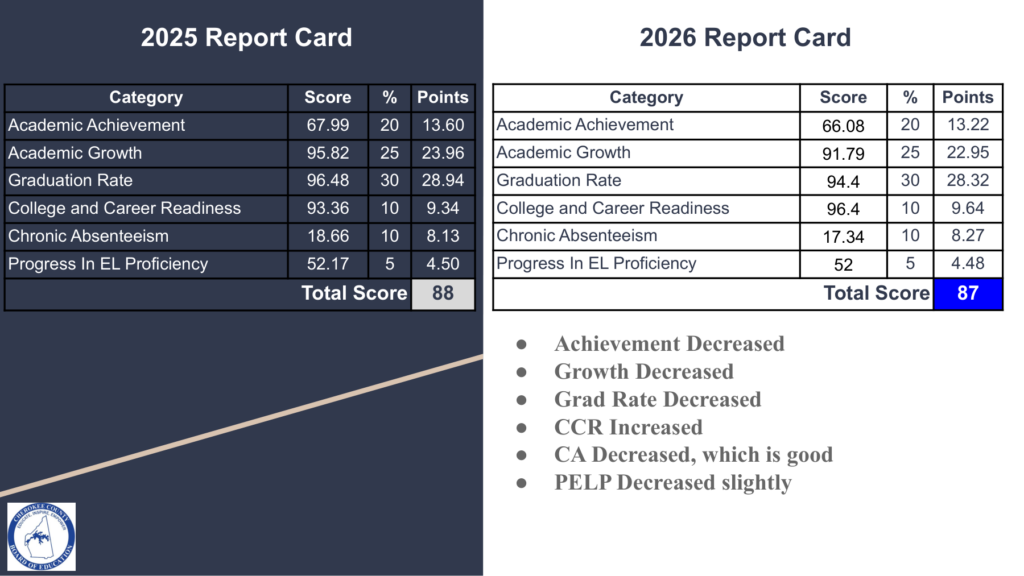
The district’s overall score changed from 88 to 87. Meanwhile, college and career readiness increased, and chronic absenteeism decreased. Source: Cherokee County Schools.
What the Report Card Measures
The system’s score combines six measures with different weights. Graduation carries 30%, academic growth contributes 25%, and academic achievement accounts for 20%.
Meanwhile, college and career readiness and chronic absenteeism each account for 10%. Progress in English-language proficiency contributes the remaining 5%.
Because the measures use different calculations, their individual scores do not all represent the same thing. Some also reflect different groups of students or earlier graduating classes.
Achievement and Growth Tell Different Stories
Academic achievement measures performance on state assessments in English language arts and mathematics. Grades three through eight take ACAP Summative, while 11th graders take the ACT with Writing.
The achievement score fell from 67.99 to 66.08. However, that figure is a weighted accountability score, rather than a simple percentage of students who passed.
The calculation assigns different point values to four performance levels. For example, Level 3 earns one point, while Level 4 earns 1.25 points.
As a result, the system benefits when students improve at every level. Ingram emphasized helping struggling students while also challenging those already meeting or exceeding expectations.
Academic growth, meanwhile, considers progress relative to Alabama students with similar earlier test results. The district’s growth score declined from 95.82 to 91.79.
However, students can demonstrate growth before reaching proficiency. Students already proficient also need to continue progressing.
Ingram identified secondary achievement and growth as areas needing attention. He also discussed strengthening foundational mathematics and English language arts skills.
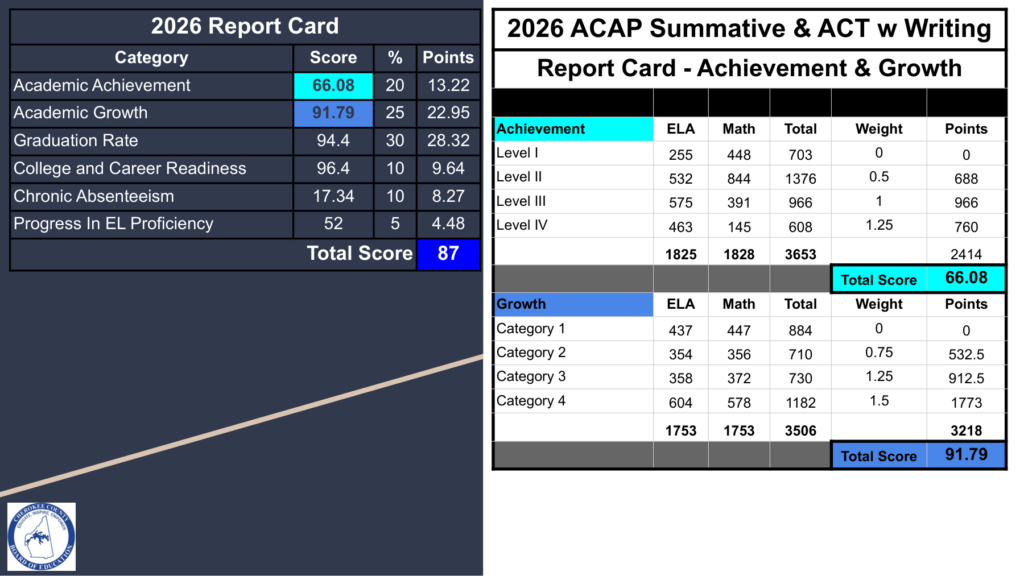
The assessment tables count English language arts and mathematics results separately, so their totals do not represent individual students. Source: Cherokee County Schools.
Graduation, Readiness, and English-Language Progress
The 2026 report card uses the graduating class of 2025 for graduation and college and career readiness. Those measures therefore lag a year behind the report’s release.
Of the 250 students in that cohort, 236 graduated within four years of entering ninth grade. The resulting graduation rate was 94.4%, compared with 96.48% on the previous report.
Meanwhile, 241 students in the same cohort met at least one college and career readiness indicator. That rate increased from 93.36% to 96.4%.
Although both measures use the same cohort, readiness and graduation are separate accomplishments. Meeting a readiness indicator does not itself establish that a student graduated.
For English-language progress, 13 of 25 students met their growth targets, or 52%. The previous report showed 52.17%.
However, the accountability calculation compares that result with a state target of 58%. Dividing 52 by 58 produces a normalized score of 89.66, worth 4.48 points toward the district total.
That 89.66 is therefore an accountability calculation, rather than the percentage of English learners meeting their targets.
Attendance Concerns Increase in the Upper Grades
Chronic absenteeism declined from 18.66% to 17.34%. Still, 663 of the district’s 3,823 students met the chronic-absence threshold.
For this report, that threshold is 18 or more missed school days. Both excused and unexcused absences count.
The largest concerns appeared in 12th grade, at 34.59%, and 11th grade, at 32.74%. In other words, approximately one-third of students in each grade met the threshold.
Kindergarten also showed a substantial concern at 20.18%, while 10th grade stood at 19.52%. By comparison, second grade had the lowest rate, 8.24%, followed by fourth grade at 11.46%.
Because the report awards points for students who are not chronically absent, a lower absence rate helps the overall score. The district earned 8.27 of the 10 available attendance points.
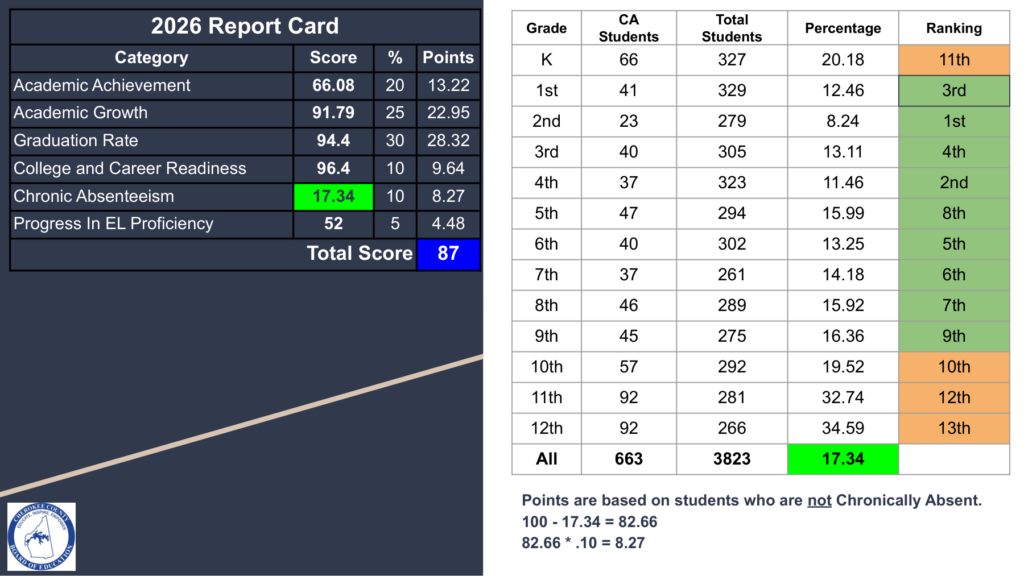
The grade-level breakdown shows the greatest attendance concerns among juniors and seniors. However, kindergarten also exceeded 20%. Source: Cherokee County Schools.
Ingram emphasized that missed instruction matters beyond the report card. Absences also reduce opportunities for classroom feedback, academic support, and relationships that help students stay engaged.
Making up assignments, therefore, does not fully replace participating in classroom instruction. However, the discussion also acknowledged circumstances that require students to miss school.
Board Questions Address Testing and Attendance Barriers
One board member asked about the balance between teaching students to learn and preparing them for standardized tests. Ingram responded that ACAP aligns with Alabama’s academic standards.
He also explained that teachers can teach those standards while helping students understand assessment question formats.
Another question concerned whether additional attendance incentives or consequences would help. Ingram said both might have a role and suggested learning from surrounding systems’ approaches.
Board members also asked about earlier parent notifications and family cooperation. Staff described earlier outreach and personal calls alongside automated messages, although responses from families vary.
Meanwhile, a question about necessary medical appointments highlighted the limits of treating every absence the same. The discussion distinguished daily attendance calculations from absences in individual class periods.
Staff explained that attending more than half the school day can prevent a full-day absence in the chronic-absence calculation. However, a student can still miss individual classes, which matters under separate exam-related attendance rules.
Families therefore need to discuss appointments and attendance records with their schools. When practical, attending before or after an appointment can preserve instructional time while allowing necessary care.
The broader response involves parents, students, and schools working together. Ingram called for identifying students approaching the threshold, communicating with families, and addressing the reasons behind missed days.
Schools can also pair that outreach with academic support and efforts to strengthen student engagement. The goal is more time learning, rather than assuming every absence reflects a lack of effort.
A Next-Year Example, Not an Official Result
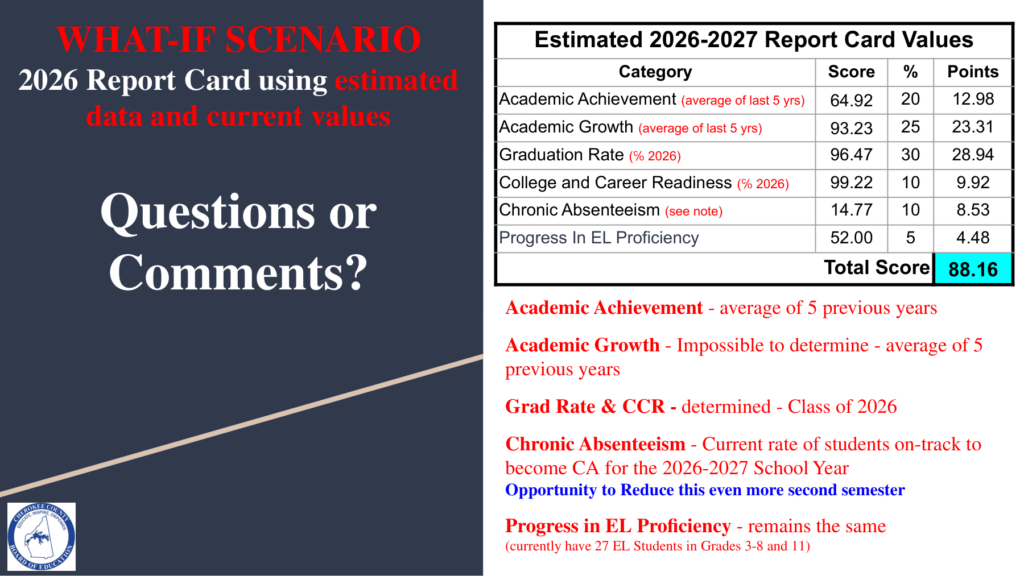
Finally, Ingram presented a hypothetical 2026-27 report card. He stressed that the example was not an official result.
It combines five-year achievement and growth averages with class-of-2026 graduation and readiness figures. It also uses the current percentage of students on track for chronic absence and holds English-language progress unchanged.
Consequently, the example illustrates how different measures affect the total; it does not guarantee next year’s score. Ingram’s central message was that instruction, attendance, and student support can still influence the outcomes ahead.
To listen to the whole meeting click below.



You must be logged in to post a comment.