
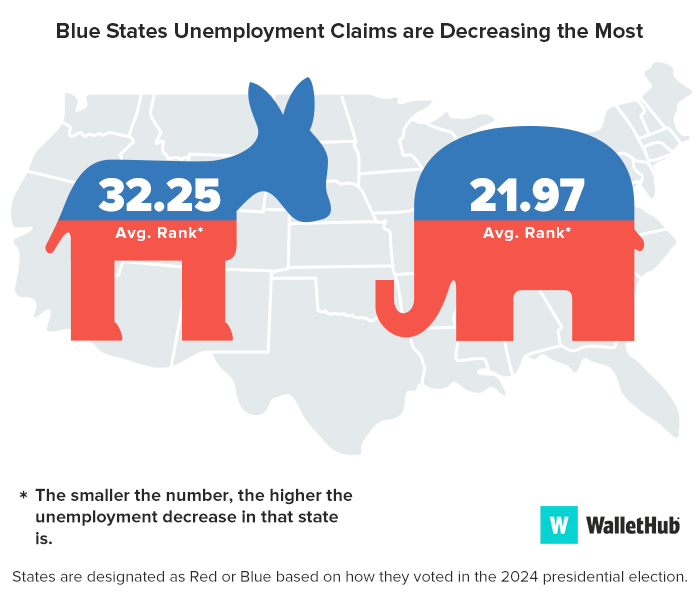
Alabama Leads Nation in Declining Unemployment Claims, WalletHub Study Finds

Alabama is seeing significant improvement in its unemployment outlook, ranking No. 1 in the nation for decreasing unemployment claims, according to a new report from WalletHub. The study, which compares unemployment trends across all 50 states and the District of Columbia, highlights Alabama as the strongest-performing state in week-to-week jobless claim improvement.
WalletHub’s analysis shows that Alabama’s unemployment claims dropped 50.57% compared to the previous week—the largest decline in the United States. Claims were also 25.78% lower than the same week last year, reflecting ongoing recovery and stability in the state’s job market.
Alabama’s Rankings (1 = Best; 25 = Average)
-
1st – Unemployment Claims Decrease vs. Previous Week
-
6th – Unemployment Claims Decrease vs. Same Week Last Year
-
8th – Cumulative Unemployment Claims in 2025 vs. Same Period Last Year
-
6th – Unemployment Claims per 100,000 People in the Labor Force
The strong performance places Alabama at the top of WalletHub’s overall rankings.
National Trends Show a Mixed Picture
Nationally, unemployment has remained relatively stable over the past year, though fluctuations and a slight upward trend have been noted. For the week of November 24, new unemployment claims across the U.S. fell by 12.4% from the previous week, a sign that the broader job market remains resilient.
However, the overall unemployment figure remains substantial, with 7.6 million Americans currently out of work.
WalletHub reported that every state except 13—including Nebraska, North Dakota, Wisconsin, Iowa, Vermont, Oregon, and Pennsylvania—saw a decrease in claims compared to the prior week. Yet, despite week-to-week improvements, 19 states and Washington, D.C. posted worse unemployment numbers than the same week a year ago.
How the Rankings Were Determined
To assess how unemployment claims are shifting, WalletHub examined changes across several benchmark weeks and compared cumulative 2025 claims to the same period in 2024. The study also evaluated the number of weekly claims per 100,000 workers in each state’s labor force.
With sharp declines on both weekly and yearly metrics, Alabama stands out as a national leader in labor market recovery heading into the end of 2025.
https://wallethub.com/edu/states-unemployment-claims/72730
| State | Decreased Most Since Last Week* | Claims Per 100,000 People in the Labor Force (Rank)** |
|---|---|---|
| Alabama | 1 | 6 |
| Arizona | 2 | 5 |
| Georgia | 3 | 8 |
| North Carolina | 4 | 3 |
| Florida | 5 | 1 |
| Louisiana | 6 | 7 |
| New Hampshire | 7 | 2 |
| Indiana | 8 | 12 |
| Arkansas | 9 | 21 |
| Oklahoma | 10 | 9 |
| West Virginia | 11 | 18 |
| Texas | 12 | 13 |
| Mississippi | 13 | 15 |
| South Carolina | 14 | 11 |
| Maryland | 15 | 10 |
| Nevada | 16 | 31 |
| Massachusetts | 17 | 32 |
| Utah | 18 | 20 |
| Wyoming | 19 | 28 |
| California | 20 | 42 |
| Hawaii | 21 | 26 |
| Kansas | 22 | 14 |
| Michigan | 23 | 34 |
| Missouri | 24 | 16 |
| Delaware | 25 | 25 |
| Idaho | 26 | 33 |
| Washington | 27 | 37 |
| Colorado | 28 | 23 |
| New Mexico | 29 | 22 |
| New York | 30 | 35 |
| Tennessee | 31 | 19 |
| Ohio | 32 | 30 |
| South Dakota | 33 | 17 |
| Montana | 34 | 47 |
| Virginia | 35 | 4 |
| Wisconsin | 36 | 43 |
| Maine | 37 | 29 |
| Alaska | 38 | 44 |
| Iowa | 39 | 39 |
| Illinois | 40 | 38 |
| New Jersey | 41 | 45 |
| Connecticut | 42 | 41 |
| Rhode Island | 43 | 46 |
| Minnesota | 44 | 50 |
| Vermont | 45 | 40 |
| Kentucky | 46 | 24 |
| Pennsylvania | 47 | 48 |
| North Dakota | 48 | 49 |
| Oregon | 49 | 51 |
| District of Columbia | 50 | 27 |
| Nebraska | 51 | 36 |
(Latest Week vs Previous Week)
- 1. Alabama
- 2. Georgia
- 3. Texas
- 4. North Carolina
- 5. Florida
- 47. Vermont
- 48. Iowa
- 49. Wisconsin
- 50. North Dakota
- 51. Nebraska
Detailed Findings
| State | Change in Unemployment Claims (Latest Week vs. Previous Week)* | Change in Unemployment Claims (Latest Week vs Same Week of 2024)** | Change in Unemployment Claims (Year to Date vs Same Period of 2024)*** | Unemployment Claims per 100,000 People in the Labor Force |
|---|---|---|---|---|
| Alabama | -50.57% | -25.78% | -7.84% | 46 |
| Arizona | -35.26% | -22.69% | -12.04% | 40 |
| Georgia | -44.11% | -25.54% | -5.90% | 50 |
| North Carolina | -41.56% | -19.53% | -5.09% | 38 |
| Florida | -40.35% | -11.04% | -5.81% | 32 |
| Louisiana | -35.07% | -30.64% | -1.51% | 48 |
| New Hampshire | -32.43% | -29.55% | 3.43% | 38 |
| Indiana | -18.09% | -21.64% | -12.80% | 65 |
| Arkansas | -40.28% | -6.64% | -6.56% | 83 |
| Oklahoma | -33.02% | -6.94% | 1.08% | 52 |
| West Virginia | -26.50% | -9.48% | -4.65% | 82 |
| Texas | -42.85% | 1.77% | 7.06% | 70 |
| Mississippi | -14.45% | -14.37% | -3.67% | 71 |
| South Carolina | -34.54% | 6.24% | 4.98% | 55 |
| Maryland | -26.97% | -19.12% | 13.47% | 54 |
| Nevada | -37.49% | -13.87% | 2.15% | 130 |
| Massachusetts | -15.51% | -22.33% | -8.33% | 131 |
| Utah | -26.50% | -15.51% | 7.66% | 82 |
| Wyoming | -33.53% | -8.00% | 4.30% | 119 |
| California | -36.62% | -10.86% | 0.15% | 170 |
| Hawaii | -21.18% | 17.54% | -6.34% | 118 |
| Kansas | -4.48% | 7.57% | -1.36% | 71 |
| Michigan | -6.64% | -24.25% | -0.93% | 143 |
| Missouri | -11.78% | 3.39% | 3.50% | 81 |
| Delaware | -29.76% | 1.94% | 15.14% | 92 |
| Idaho | 5.80% | -30.63% | -3.43% | 141 |
| Washington | -32.31% | 0.17% | 4.97% | 160 |
| Colorado | -25.36% | 14.03% | 10.06% | 86 |
| New Mexico | -7.12% | 3.92% | 7.50% | 83 |
| New York | -17.98% | 1.76% | 2.98% | 148 |
| Tennessee | -1.67% | -0.86% | 8.70% | 82 |
| Ohio | 6.52% | -1.89% | -3.51% | 121 |
| South Dakota | 10.03% | 0.00% | 4.73% | 82 |
| Montana | 1.30% | -1.92% | -12.25% | 201 |
| Virginia | -31.33% | 40.50% | 24.66% | 40 |
| Wisconsin | 26.52% | -14.99% | -15.80% | 174 |
| Maine | -3.58% | 19.56% | 0.55% | 120 |
| Alaska | -1.41% | 18.24% | -13.26% | 188 |
| Iowa | 24.79% | -16.94% | -9.24% | 162 |
| Illinois | -16.81% | -6.77% | 13.71% | 162 |
| New Jersey | -4.64% | 1.19% | 4.64% | 198 |
| Connecticut | 4.86% | 8.76% | 7.23% | 169 |
| Rhode Island | 5.16% | -1.91% | 9.38% | 200 |
| Minnesota | -1.60% | 2.85% | 5.23% | 238 |
| Vermont | 22.11% | -1.34% | 8.05% | 168 |
| Kentucky | -3.33% | -33.00% | 55.57% | 88 |
| Pennsylvania | 16.30% | 0.78% | 1.60% | 231 |
| North Dakota | 56.90% | -45.68% | -3.06% | 232 |
| Oregon | 17.04% | 20.02% | 8.99% | 262 |
| District of Columbia | -35.87% | 18.16% | 81.02% | 118 |
| Nebraska | 98.46% | 65.06% | 16.12% | 153 |